This is the text of my presentation to the IDU Forum in Washington DC on 07 December 2022.
We all know that the story of the US midterm elections was supposed to be a red wave, but we saw the Republicans take a slim majority in the House and go backwards in the Senate. My research, conducted in the weeks leading up to those elections, helps to explain what’s going on and what the implications are for the presidential election in 2024. The analysis is based on a poll of 20,000 Americans, together with focus groups in the crucial states of Pennsylvania, Georgia, Arizona and Florida.
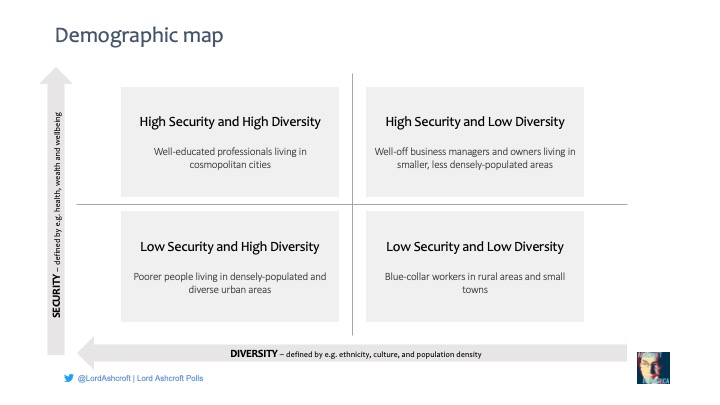
We have used a model that helps us understand the landscape of opinion and the dynamics that drive American politics. Our model maps the electorate according to their security on one hand the diversity of their communities on the other. The vertical axis represents Security, which includes measures like income, house value, education and health: the higher up the axis, the more secure. The horizontal axis represents Diversity, including factors like ethnicity, population density, urbanity and marital status: the further to the left on this axis, the more diverse the community. All of these are derived from census data. This means we have four quadrants of above and below average levels of Security and Diversity onto which we can map people, neighbourhoods, counties, Congressional districts and states.


